With investor focus now squarely back on U.S. equities as new all-time highs are in sight, we dig into why strategic allocations should still consider, despite recent outperformance and multiple expansion, diversification into international equities. Using a five-factor attribution analysis, we analyze the drivers of returns for U.S. and non-U.S. equities over the last quarter century, with a particular focus on what drove the U.S. to outperform non-U.S. equities so dramatically over the last 15 years. We then use that same analytical framework to create an illustrative scenario analysis to determine potential returns to U.S. and non-U.S. equity markets, showing why starting valuations matter — when looking far into the future.
U.S. (Equity) Exceptionalism — We Are So Back! (Right?)
The S&P 500 continues its ascent up the proverbial “wall of worry” toward fresh all-time highs (as of June 26, the large cap index closed three points away from the February 19 high), and investors are keen to hit the beach as we approach the 4th of July holiday. The debate over whether large cap U.S. stocks remain “exceptional” relative to their small cap and international peers has taken a back seat in recent weeks to geopolitical and macroeconomic headline risk; those risks have cleared (so we’re told, and for the time being), and U.S. equity markets sure feel exceptional. While there are signs and catalysts that small caps are ripe for a catch-up trade this summer (short positioning, that Big Beautiful Bill, trade deals, monetary policy changes), this week we are digging into the U.S./non-U.S. equity “exceptionalism” debate.
The MSCI USA Index (similar construction as the S&P 500, and what we will use to represent U.S. stocks) has outperformed the MSCI World ex USA Index (an index of developed non-U.S. equity markets, and what we will use to represent foreign stocks) by 4.5% points since markets troughed earlier this year on April 8. Recent U.S. outperformance notwithstanding, the non-U.S. index remains ahead of the U.S. index by ~11% year-to-date heading into the end of the first half of 2025. If that lead holds, this will mark just the fourth year in the last 16 (looking back to 2010) that developed non-U.S. stocks outperformed U.S. stocks. The question on investors’ minds is whether this is the start of a longer-term trend: a reversal of U.S. equity exceptionalism? Or just a mean-reverting aberration year?
Quick Hits on 15 Years of U.S. Equity Outperformance
Here we highlight trends in the fundamentals that explain U.S. stocks approximate 8% annualized outperformance over the last 15 years. We will see that fundamentals drove performance, while on a relative basis it was valuations, and thus expectations, that drove the majority of outperformance.
- Sales Per Share Growth. U.S. index stocks grew sales per share 5.4% a year over the period from end of 2009 to end of 2024, compared to a ~0.1% decline per year for non-U.S. index stocks over the same period, driven by:
- Sales Growth. U.S. index stocks grew dollar sales 4.2% a year over the period compared to just 0.6% a year for non-U.S. index stocks.
- Share Count Declines. U.S. index stocks’ share count declined 0.5% a year over the period, while non-U.S. index stocks grew shares by ~0.8% per year.
- Profit Margins. U.S. index stocks’ profit margins grew from 7.7% at the end of 2009 to ~13% at the end of 2024, representing annualized growth of ~2.5%. Non-U.S. stocks grew more over the period, albeit from a lower starting point, from 4.7% in 2009 to ~10.5% in 2024, representing annual growth of 5.5%. Despite higher absolute levels, the slower rate of change detracted from U.S. outperformance over the period.
- Dividend Yield. Dividends contributed 2.1% to the annualized return, compared to 3.4% for the non-U.S. index. The U.S. index dividend payout ratio, as well as trailing dividend yields, was below that of the non U.S. index, over the 2009 to 2024 period. Dividends were also a detractor to U.S. outperformance.
- Valuations. The U.S. index price to earnings (P/E) ratio grew over the period at a 2.5% compound annual growth rate (CAGR), from 16.7x at 2009 year-end, to ~24x at the end of 2024; the non-U.S. index P/E declined at a 2.8% CAGR over the period, from ~20.6x to ~13.6x.
Adding it all up from a purely fundamental perspective (i.e., excluding valuations, or what the market paid for those fundamentals), sales per share contributions, driven by faster sales growth and greater reduction in shares, were somewhat offset by slower relative margin growth and less generous dividend payouts, and represented about 2.8% of the 8% total return outperformance, or 35% of the total. The larger piece of this decomposition, as well as the more interesting and relevant for where equities may go in the future, is the difference in multiple expansion / valuation seen over the last 15 years, which made up the remaining ~65% of U.S. equity outperformance.
Starting Valuations Matter With Strategic (Longer) Investment Horizons
Focusing too much on valuation levels over shorter investment horizons (roughly defined as a few months to a few years), especially at a market or index level, can be hazardous to your bottom line. In short- to medium-term horizons, we focus more on relative price trends, sentiment, and fundamental momentum indicators such as earnings revisions. These are the factors that drive our Tactical Asset Allocation (TAA) at LPL Research; while we don’t completely ignore valuations, we typically don’t make large tactical calls — such as overweighting international stocks relative to domestic stocks — based solely on relative valuations.
However, when we develop our Strategic Asset Allocation (SAA) and Capital Market Assumptions (CMA) each year, valuations do more of the heavy lifting. My colleague George Smith laid this out well in a Weekly Market Commentary earlier this year:
“Valuations play a particularly critical role in this framework, as historically they have demonstrated a high correlation with long-term market performance. The price-to-earnings ratio (P/E) for the S&P 500 Index, for example, has shown predictive power for subsequent decade-long returns, with higher P/Es typically preceding weaker long-term performance and lower P/Es often followed by stronger results.”
That note also did a great job of outlining how the TAA and SAA differ. While the following charts make it clear that U.S. equities remain at elevated valuation spreads relative to non-U.S. equities, that alone is not basis enough for an allocation change, especially for investors following a tactical asset allocation; however, the relative price trends do make for frequent debate in our weekly Strategic and Tactical Asset Allocation Committee (STAAC) meetings.
As highlighted in the prior section, U.S. equity multiple expansion over the last 15 years contributed over 5% of the 8% annualized excess total return, or about 65%. The combination of sales, profit margins, and share count (i.e., earnings per share), plus dividends, contributed less than half of the relative outperformance. Thus, market implied expectations are that fundamental growth in U.S. equities will continue to outpace that of non-U.S. equities well into the future. Market history has repeatedly shown that nothing lasts forever; the best part about long-term investment horizons is that you don’t have to successfully know when forever ends.
P/E Ratios Over Time (USA vs Developed Markets ex USA)
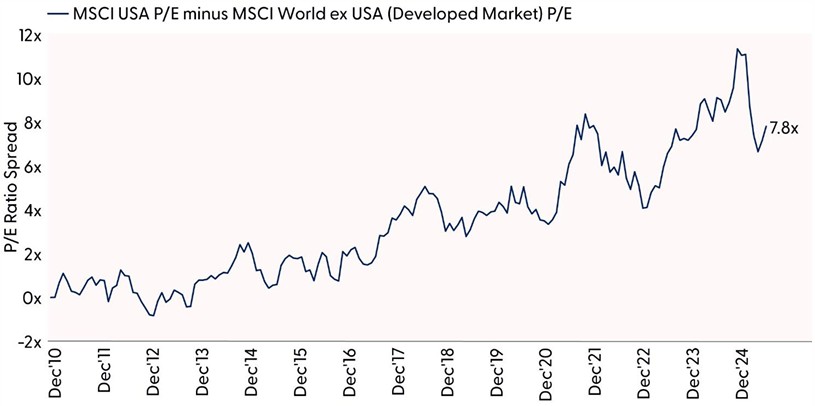
Source: LPL Research, Bloomberg, MSCI 06/25/25
Disclosures: Indexes are unmanaged and cannot be invested in directly. Past performance is no guarantee of future results.
Decomposition Scenario Analysis Makes the Case for International Diversification
To illustrate this concept, we have taken a page from respected investor, Christopher Bloomstran at Semper Augustus Investments Group. Semper’s annual letter is available online. His five-factor attribution analysis is useful for individual equities, as well as equity indexes. The preceding decomposition of the returns from 2009 to 2024, as well as the subsequent illustrative scenario analysis, leverages this framework.
Using the five factors we have covered (dollar sales growth, share count change, profit margin change, valuation multiple expansion/contraction, and dividends), one can model expected returns over any given period. Our analysis is focused on long-term strategic equity allocations; thus, we model 10 years out.
The assumptions made in our scenario analysis are outlined in the table and suggest a potential 3.2% annualized outperformance for international equities over the next 10 years. Note this illustrative analytical framework is separate from the quantitative work that builds our CMA and SAA, and yet the outcomes are in the same zip code, which provides confidence that the underlying assumptions and mechanics are sound.
To summarize the assumptions: For both U.S. and non-U.S. stocks, we assume annualized 4%-dollar sales growth and a 1% reduction in share counts. For margins and dividend payouts, we maintain 2024 levels for both U.S. and non-U.S. equities: 13% and 10.5%, respectively on margins, and 31% and 43% respectively on dividend payout ratios. For valuations, we kept the U.S. at the current and year-end level of 24x trailing earnings per share and used the current multiple of 16x for non-U.S. equities. The current non-U.S. equity multiple of 16x is ~18% higher than the 13.6x multiple at year-end and explains 1.7% of the 3.2% excess performance. Effectively, 1.7% from multiple expansion has already been achieved year-to-date, and our analysis assumes no further multiple expansion. The remainder of the excess return suggested in our scenario analysis comes from dividends — the non-U.S. index provides ~1.4% incremental return over the U.S. index.
Hopefully, walking through a scenario model such as this provides helpful context when thinking about the drivers of returns, and particularly how starting valuation levels impact long-term forward returns. For example, if we took the U.S. P/E ratio down 2.5 turns to a still above-average 21.5x, that would shave 1% off annual expected returns; another 2.5 turns would bring the multiple to more historically average 19x, while cutting another 1% off annualized returns.
Starting Valuations Give Foreign Equities Path to Outperform U.S. Equities Over Next 10 Years
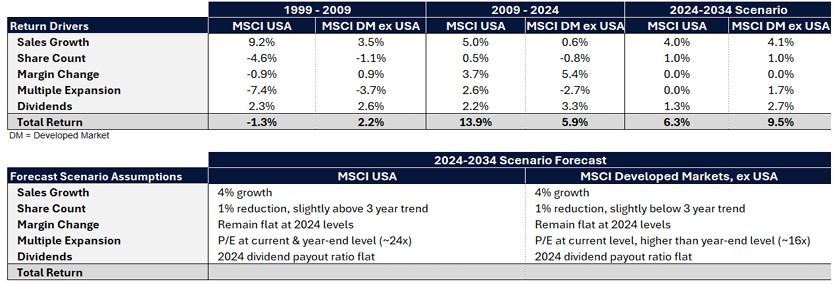
Source: LPL Research, Bloomberg, MSCI 06/25/25
Disclosures: All indexes are unmanaged and cannot be invested in directly. Past performance is no guarantee of future results. Estimates may not materialize as predicted and are subject to change.
Asset Allocation Insights
In May, the LPL Research Strategic and Tactical Asset Allocation Committee (STAAC) raised its outlook on emerging markets (EM) equities to neutral from underweight, reflecting both fundamental and technical improvements in the category. The decision was also influenced by the STAAC’s desire to stay closer to benchmarks amid greater policy uncertainty. EM equity valuations remain attractive, and the burgeoning downtrend in the U.S. dollar offers additional upside potential for international equities. Additionally, easing trade tensions with China have contributed to a more favorable environment for EM equities and investors may increasingly view EM as an attractive option for growth and diversification in the second half. Overall, the STAAC maintains its tactical neutral stance on equities, with a preference for large caps over small and growth over value. LPL Research continues to monitor tariff negotiations, the Israel-Iran conflict, economic data, earnings, the bond market, and various technical indicators to identify a potentially more attractive entry point to add equities on weakness.
For fixed income, the STAAC holds a neutral weight in core bonds, with a slight preference for mortgage-backed securities (MBS) over investment-grade corporates. The Committee remains neutral duration relative to benchmarks, favoring the intermediate part of the yield curve.
Important Disclosures
This material is for general information only and is not intended to provide specific advice or recommendations for any individual. There is no assurance that the views or strategies discussed are suitable for all investors or will yield positive outcomes. Investing involves risks including possible loss of principal. Any economic forecasts set forth may not develop as predicted and are subject to change.
References to markets, asset classes, and sectors are generally regarding the corresponding market index. Indexes are unmanaged statistical composites and cannot be invested into directly. Index performance is not indicative of the performance of any investment and do not reflect fees, expenses, or sales charges. All performance referenced is historical and is no guarantee of future results.
Any company names noted herein are for educational purposes only and not an indication of trading intent or a solicitation of their products or services.
All information is believed to be from reliable sources; however, LPL Financial makes no representation as to its completeness or accuracy.
All investing involves risk, including possible loss of principal.
US Treasuries may be considered “safe haven” investments but do carry some degree of risk including interest rate, credit, and market risk. Bonds are subject to market and interest rate risk if sold prior to maturity. Bond values will decline as interest rates rise and bonds are subject to availability and change in price.
The Standard & Poor’s 500 Index (S&P500) is a capitalization-weighted index of 500 stocks designed to measure performance of the broad domestic economy through changes in the aggregate market value of 500 stocks representing all major industries.
The PE ratio (price-to-earnings ratio) is a measure of the price paid for a share relative to the annual net income or profit earned by the firm per share. It is a financial ratio used for valuation: a higher PE ratio means that investors are paying more for each unit of net income, so the stock is more expensive compared to one with a lower PE ratio.
Earnings per share (EPS) is the portion of a company’s profit allocated to each outstanding share of common stock. EPS serves as an indicator of a company’s profitability. Earnings per share is generally considered to be the single most important variable in determining a share’s price. It is also a major component used to calculate the price-to-earnings valuation ratio.
All index data from FactSet or Bloomberg.
This research material has been prepared by LPL Financial LLC.
For public use.
Member FINRA/SIPC.
RES-0004479-0525 Tracking #761272 | #761292 (Exp. 06/26)
Not Insured by FDIC/NCUA or Any Other Government Agency | Not Bank/Credit Union Guaranteed | Not Bank/Credit Union Deposits or Obligations | May Lose Value