There has been no shortage of trade policy curveballs thrown at the market since the White House announced shockingly high reciprocal tariffs on April 2. Stocks fell sharply and interest rates spiked on that news, prompting President Trump to pivot to a 90-day reciprocal tariff pause. Since then, trade negotiations have generally progressed, albeit slowly. Then, last week, came another curveball with the U.S. Court of International Trade (CIT) ruling that essentially blocked most of President Trump’s tariffs. Here we discuss what this news means, where the Trump administration goes next, and potential market implications. The legal backdrop has shifted, but the investing landscape really hasn’t changed much.
What Happened
On Wednesday, May 28, the U.S. Court of International Trade (CIT) essentially blocked the majority of President Trump’s tariffs. A three-judge panel issued summary judgment against the tariffs enacted under the International Emergency Economic Powers Act (IEEPA), claiming they were unconstitutional and “exceed any authority granted by the President by IEEPA.” The Court’s ruling blocks the following tariffs:
- 10% universal or baseline tariff
- 20% additional tariff on imports from China (tied to fentanyl)
- 25% tariff on non-compliant United States-Mexico-Canada Agreement (USMCA) goods
Importantly, this ruling should not impact tariffs imposed under Section 232 (steel, aluminum, autos) or President Trump’s ability to levy other sectoral tariffs, such as pharmaceuticals and semiconductor tariffs tied to national security.
The administration has been granted a stay, or pause, pending the completion of the appeal process. Depending on the ruling by the U.S. Court of Appeals for the Federal Circuit, the legal authority of these tariffs may go to the Supreme Court. Goldman Sachs estimates that 6.7% of the tariff increase since the start of the year could be removed. That would take the rate down to about 6% if those tariffs are removed and stay off. However, the administration has a plan B, a plan C, and perhaps even D and E.
What’s Next
The Court’s ruling marks a setback for President Trump’s initial trade strategy, but it does not mark the end of tariffs. There are several legal avenues the administration could explore to reinstate tariffs:
- Section 338: The administration could leverage Section 338 of the U.S. Trade Act of 1930, which gives the President unilateral authority to impose up to 50% tariffs on imports from foreign countries that are found to discriminate against U.S. commerce. Enacting Section 338, which has never been used to impose tariffs, requires no formal investigation before implementation, but it could potentially violate U.S. obligations under the World Trade Organization (WTO), which limits how much a country can raise tariffs above certain “bound” rates.
- Section 122: The administration could utilize Section 122 of the Trade Act of 1974, which addresses balance of-payment issues by granting the President authority to impose tariffs of up to 15% for 150 days against countries running large trade deficits with the U.S. (Congress can pass an extension after the 150-day time frame). This means the President could immediately counter the block of the 10% universal tariff with a new tariff of the same amount (or 5% higher) and do so quickly, but only temporarily.
- Section 301: The administration could utilize Section 301 of the U.S. Trade Act of 1974. Essentially, this allows the President to take action against countries that engage in unfair trade practices. Enacting this would take time for countries not on the 301 list, as the U.S. Trade Representative (USTR) would have to launch a formal investigation, which includes consultations with the foreign government under review and usually a public comment period. Chinese imports have been a frequent flyer on the Section 301 list, and the range of products or tariff rates could be expanded to offset the CIT ruling.The administration could utilize Section 301 of the U.S. Trade Act of 1974. Essentially, this allows the President to take action against countries that engage in unfair trade practices. Enacting this would take time for countries not on the 301 list, as the U.S. Trade Representative (USTR) would have to launch a formal investigation, which includes consultations with the foreign government under review and usually a public comment period. Chinese imports have been a frequent flyer on the Section 301 list, and the range of products or tariff rates could be expanded to offset the CIT ruling.
- Section 232: The administration could use Section 232 of the Trade Expansion Act of 1962. This allows the President to adjust imports of goods that “threaten to impair” national security. President Trump has already enacted this law to impose duties on steel, aluminum, and auto imports. These sectoral tariffs could be expanded after a formal investigation is conducted by the U.S. Department of Commerce, which can take several months on the low end.
Our sources in Washington, D.C. suggest two potential likely paths. Either using 338, or a combination of 122 and 232. Either way, tariff rates are likely to get back over 10% and stay there, one way or another.
Average Tariff Rates Still Likely to Go Higher Despite Court Ruling
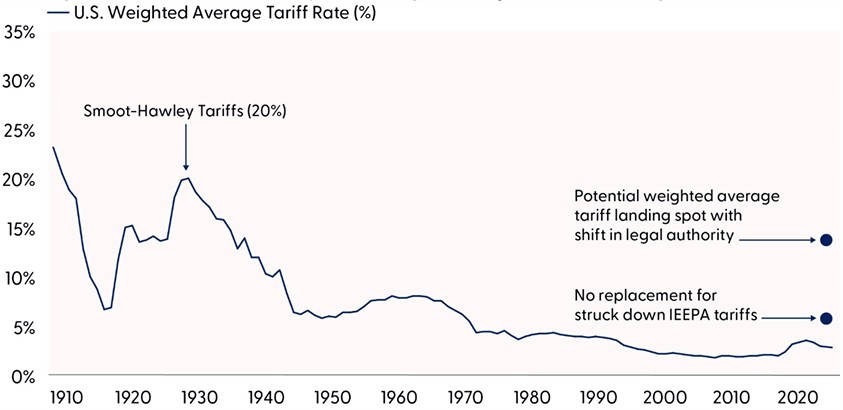
Source: LPL Research, U.S. International Trade Commission, Bloomberg, 05/29/25
Estimates may not materialize as predicted and are subject to change.
IEEPA is the International Emergency Economic Powers Act.
Tariffs and Stock Market Volatility Likely to Stick
Tariffs are an important part of the Trump administration’s trade policy as leverage for trade negotiations with other countries and as a source of revenue. Given our expectation that overall weighted average tariff rates will land in the mid-teens when all is said and done, our expectations for earnings have not changed following this latest temporary tariff setback for the Trump administration.
For stock investors, that means the stimulus from the tax bill should remain in forecasts for economic growth and corporate profits, as well as inflation. But that doesn’t mean the broad market will rally to new highs this year because of how much optimism is already priced in.
We believe consensus earnings estimates from individual analysts aggregated (bottom up) and from strategists (top down) are too high for the current expected tariff regime. Our expectation is tariffs will drag S&P 500 earnings per share (EPS) down 2–3%, to perhaps $255 in 2025. As some tax policy and artificial intelligence (AI) tailwinds blow in 2026, the S&P 500 could deliver $275 in S&P 500 EPS next year. If that $275 number is right, then more than a 22 price-to-earnings ratio (P/E) is needed to reach new highs by year-end. The index is trading at a 21.4 P/E now. That tells us this market needs unexpected earnings upside or lower interest rates.
We’re also concerned about the asymmetric risk around trade policy. Markets seem confident these trade deals will get worked out smoothly and quickly, and that tariff rates will end up below our expectations. While this is possible, we believe the market is over-confident in this blue-sky scenario. The probability of our bull case (6,100 to 6,200) by year-end has admittedly risen since larger tariffs seem to have been taken off the table and the AI investment outlook firmed, but the news that China trade talks have stalled provided a reminder of the downside risk to trade policy.We’re also concerned about the asymmetric risk around trade policy. Markets seem confident these trade deals will get worked out smoothly and quickly, and that tariff rates will end up below our expectations. While this is possible, we believe the market is over-confident in this blue-sky scenario. The probability of our bull case (6,100 to 6,200) by year-end has admittedly risen since larger tariffs seem to have been taken off the table and the AI investment outlook firmed, but the news that China trade talks have stalled provided a reminder of the downside risk to trade policy.
Dr. Jekyll and Mr. Hyde Bond Market
While the on-again/off-again tariff bruhaha introduces potential market volatility to the Treasury market, the actual impact of tariffs is mixed. Tariffs, as a trade policy lever, introduce a tug-of-war interaction between inflationary pressures (higher yields), slowing growth expectations (lower yields), and the potential to increase federal revenue (lower yields). The initial reaction from Trump’s sweeping tariffs on April 2 has pushed the 10-year Treasury yield some 50 basis points higher as markets have priced in a more hawkish Federal Reserve (Fed) response to rising price pressures. Further increasing yields, however, are growing concerns about debt and deficit spending as the Republican’s tax bill gets legislated through Congress.
Initial estimates suggest, in a best-case scenario, that deficits will continue to run in the 6–7% range of gross domestic product (GDP), suggesting Treasury issuance will need to remain elevated to fill the budget gap. To help fill those gaps, tariffs are expected to bring in $2 to $3 trillion in revenue over a 10-year horizon. That additional tariff revenue would likely be enough to offset most, if not all, of the expected deficit spending with the current bill in Congress. Again, we do not think the court’s recent decision to challenge the legality of tariffs puts that additional revenue source at risk. We do not expect this revenue to go away, and if it does, it will be the Trump administration’s decision, not the courts, to reduce or eliminate tariffs.
Tariffs also introduce risk to global growth, the antidote to most of our fiscal woes. Weak growth means low tax receipts. As the “Federal Interest Payment Getting Dangerously High” chart illustrates, roughly 18% of gross federal tax receipts go to interest payments. The ratio is at the peak from the early 1990s, when the economy was coming out of a recession. As the chart illustrates, the ratio falls as tax receipts grow from a robust economy.
The additional costs associated with tariffs are borne by someone, somewhere, so that ultimately means less resources to spend elsewhere, all else equal. So far, economic data hasn’t shown signs of a broad-based weakening economy (although the so-called “soft” data from surveys has been downbeat). Last week’s rise in initial jobless claims and the revised first quarter GDP print that reflected a weaker than originally expected consumer brought yields down. And recent inflation data, albeit surprisingly low in April, will likely reaccelerate throughout the remainder of 2025 as both supply and demand pressures push annual inflation rates higher.
Much has been written about the potential headwinds to Treasury yields, including policy uncertainty, a related increase in term premium (to encourage markets to hold long-term debt), an ongoing lack of fiscal restraint, fear of asset sales from the “de-dollarization” and “sell America” stories, a potentially more dovish Fed next year, a resilient economy, and higher non-U.S. yields. But ultimately, Treasury yields are primarily a function of growth and inflation expectations, so as the economic data goes, so go Treasury yields.
No doubt, obstacles remain to a sustained move lower in rates, but if the economic data starts to show a weakening economy, particularly with this week’s jobs report, Treasury yields will likely fall from elevated levels. Until the economic data softens, we think volatility in the Treasury market is here to stay, which should allow markets to price in more rate cuts from the Fed.
Federal Interest Payments Getting Dangerously High
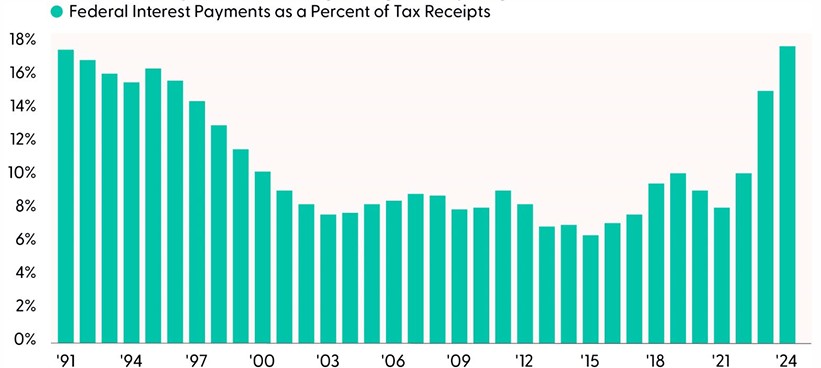
Source: LPL Research, U.S. Treasury, 05/29/25
Technically Speaking, Consider Dips Above Support Levels as Potential Buying Opportunities
Stocks have quickly climbed the wall of worry back toward record-high territory. The sharp rally off the April lows has left many investors surprised by the speed of the recovery, especially on the institutional side of asset management, where the pain trade has been most pronounced. The more than 19% rally witnessed over the last six weeks is rare but not unprecedented. In fact, the S&P 500 has rallied 15% or more in 28 trading days 11 other times since 1950. Forward 12-month returns after these occurrences averaged 26%, with all 11 periods producing positive returns.
While the macro backdrop remains muddied by ongoing trade policy uncertainty, technical analysis can help cut through some of the noise and assess the durability of the recent rally. The S&P 500 has made notable technical progress on an absolute basis, including the reversal of a downtrend off the February highs and notably gapping above its closely watched 200-day moving average (dma). Over half of S&P 500 stocks have also recaptured their 200-dma, with cyclical sectors generally exhibiting the strongest momentum and breadth. Our trend model, which utilizes short, intermediate, and long-term moving average positioning to define trends, has undergone significant improvement. Since the April 8 low, the percentage of S&P 500 stocks in some form of an uptrend has jumped from 29.4% to 60.0% last week. Technology, which accounts for roughly a 30% weight within the S&P 500, has witnessed the biggest shift, as the percentage of the sector’s stocks in uptrends surged from under 10% at the start of the month to 88% last week.
Overall, the weight of the technical evidence suggests this recovery is real, and not a “bull trap” or “bear market rally.” For investors, this means dips above support should be considered buying opportunities.
The Balance of S&P 500 Uptrends Versus Downtrends Has Notably Improved
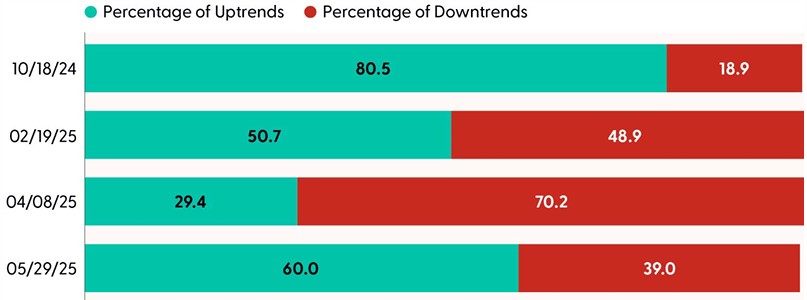
Source: LPL Research, Bloomberg, 05/29/25
Indexes are unmanaged and cannot be invested in directly. Past performance is no guarantee of future results.
Conclusion
The recent CIT summary judgment blocking the legal authority behind most of Trump’s tariffs adds some complexity to an already messy trade outlook. However, one way or another, these mid-teens tariff rates are likely to stick. The administration has a range of legal paths to restore these tariffs if they are ruled illegal under the IEEPA on appeal. Trade negotiations will continue, economic growth and deficit concerns will remain, and markets are likely to continue to be volatile around lingering trade policy uncertainty.
Bottom line, investors should expect bouts of market turbulence until there is greater clarity on trade. Stocks are pricing in a lot of good news, and bonds face some significant headwinds. We do not believe now is the time for investors to increase portfolio risk levels and continue to wait for a pullback before considering adding equities. Based on current information, we believe the S&P 500 is at fair value and material additional upside would require an upside surprise on earnings and Treasuries (lower rates). The path of tariffs and the tax bill will be key.
Asset Allocation Insights
LPL’s Strategic and Tactical Asset Allocation Committee (STAAC) maintains its tactical neutral stance on equities. Following the recent stock market rebound, the Committee does not rule out the possibility of a reversal lower amid ongoing uncertainty around tariffs. LPL Research continues to monitor tariff negotiations, economic data, earnings, the bond market, and various technical indicators to identify a potentially more attractive entry point to add equities on weakness.
During periods of policy uncertainty, LPL Research prefers to stray little from its benchmarks. In that spirit, the Committee recently upgraded emerging market (EM) equities to neutral, leaving regional preferences across the U.S, developed international, and EM aligned with benchmarks. Among sectors, the Committee favors just communication services and financials.
Within fixed income, the STAAC holds a neutral weight in core bonds, with a slight preference for mortgage-backed securities (MBS) over investment-grade corporates. The Committee believes the risk-reward for core bond sectors (U.S. Treasury, agency MBS, investment-grade corporates) is more attractive than plus sectors. The Committee does not believe adding duration (interest rate sensitivity) at current levels is attractive and remains neutral relative to benchmarks. The Committee would get more interested in adding long-term bonds if the U.S. 10-Year Treasury yield got closer to 5%.
Important Disclosures
This material is for general information only and is not intended to provide specific advice or recommendations for any individual. There is no assurance that the views or strategies discussed are suitable for all investors or will yield positive outcomes. Investing involves risks including possible loss of principal. Any economic forecasts set forth may not develop as predicted and are subject to change.
References to markets, asset classes, and sectors are generally regarding the corresponding market index. Indexes are unmanaged statistical composites and cannot be invested into directly. Index performance is not indicative of the performance of any investment and do not reflect fees, expenses, or sales charges. All performance referenced is historical and is no guarantee of future results.
Any company names noted herein are for educational purposes only and not an indication of trading intent or a solicitation of their products or services. LPL Financial doesn’t provide research on individual equities.
All information is believed to be from reliable sources; however, LPL Financial makes no representation as to its completeness or accuracy.
All investing involves risk, including possible loss of principal.
US Treasuries may be considered “safe haven” investments but do carry some degree of risk including interest rate, credit, and market risk. Bonds are subject to market and interest rate risk if sold prior to maturity. Bond values will decline as interest rates rise and bonds are subject to availability and change in price.
The Standard & Poor’s 500 Index (S&P500) is a capitalization-weighted index of 500 stocks designed to measure performance of the broad domestic economy through changes in the aggregate market value of 500 stocks representing all major industries.
The PE ratio (price-to-earnings ratio) is a measure of the price paid for a share relative to the annual net income or profit earned by the firm per share. It is a financial ratio used for valuation: a higher PE ratio means that investors are paying more for each unit of net income, so the stock is more expensive compared to one with lower PE ratio.
Earnings per share (EPS) is the portion of a company’s profit allocated to each outstanding share of common stock. EPS serves as an indicator of a company’s profitability. Earnings per share is generally considered to be the single most important variable in determining a share’s price. It is also a major component used to calculate the price-to-earnings valuation ratio.
All index data from FactSet or Bloomberg.
This research material has been prepared by LPL Financial LLC.
Not Insured by FDIC/NCUA or Any Other Government Agency | Not Bank/Credit Union Guaranteed | Not Bank/Credit Union Deposits or Obligations | May Lose Value
For public use.
Member FINRA/SIPC.
RES-0004479-0525 | Tracking #747716 | #747718 (Exp. 06/26)